

Is Gold Truly the Best Inflation Hedge? 50 Years of Data Shows a Different Story
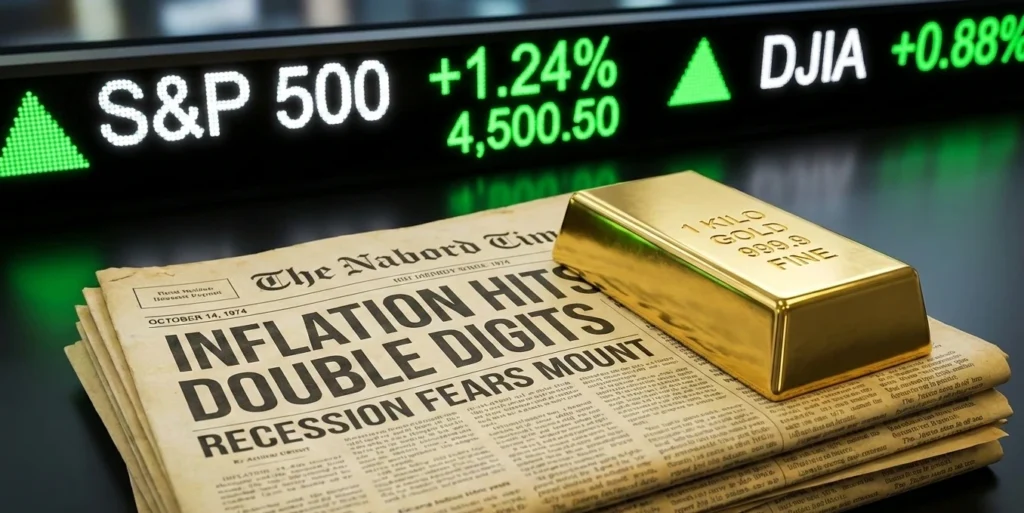
When the consumer price index (CPI) prints a number higher than a central banker’s target, the financial media instinctively retreats to a 5,000-year-old script: “Buy gold.” We are told that gold is the ultimate insurance policy—a “safe haven” that preserves purchasing power when paper money goes to die. But as we move into 2025, it is time to ask: is gold truly the best inflation hedge, or are we simply repeating a dogma that hasn’t been verified by the math of the last half-century.
For the modern investor, the stakes of this question are astronomical. Between gold investment 2025 hype and the rising noise of currency debasement, the retail portfolio is being pulled into an asset that pays no dividend, produces no cash flow, and costs money to store. If you are looking for the historical performance of gold to save you from inflation portfolio strategy blunders, you need more than a brochure from a bullion dealer. You need the cold, hard data comparing gold vs stocks during inflation. As it turns out, the “shiny yellow rock” isn’t the shield you were promised; it’s a volatile speculative instrument that just happened to have one very good decade fifty years ago.
The Dogma vs. The Data: Why Do We Believe Gold is a ‘Safe Haven’?
The myth of gold as the “Golden Constant” is rooted in a psychological phenomenon known as Recency Bias, specifically anchored to the 1970s. During that decade, the U.S. moved off the gold standard, and inflation averaged 7.1%, peaking at nearly 15% in 1980. During that specific window, gold surged over 1,300%. For a generation of investors, that singular event cemented gold’s reputation as the premier tool for wealth preservation in crisis.
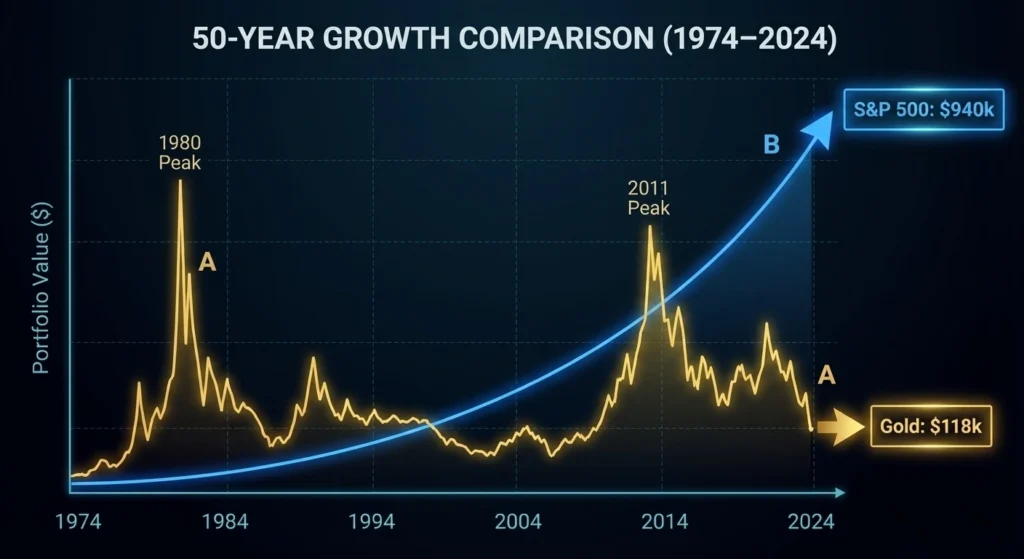
However, the myths of gold investing fall apart when you look at the 1980s and 1990s. Despite persistent (albeit lower) inflation throughout those twenty years, the nominal price of gold actually fell. If gold were a true hedge, its price would move in lockstep with the cost of living. Instead, an investor who bought gold at its 1980 peak waited until 2007—nearly three decades—just to see the price return to its original nominal value. When adjusted for inflation, that investor’s gold real returns were catastrophic.
Skeptic’s Truth Bomb: Gold is not an “inflation hedge” in any practical human timeframe. It is a bet on the acceleration of fear. If inflation stays high but stable, gold often does nothing. If you bought gold in 1980 to protect your wealth, you lost 65% of your purchasing power over the next 20 years while the S&P 500 grew by over 1,000%.
If you want to see this ‘Stealth Default’ in action within your own bank account, look no further than the Great Resignation myth and the clinical reality of real wage growth. It is the ultimate proof that whether you hold a bar of gold or a bigger paycheck, the math of inflation is designed to ensure you lose ground while feeling like you’re moving forward.”
Data Analysis: Gold vs. Equity vs. Bonds (1974–2024)
To understand why gold is a sub-optimal hedge for a retirement portfolio, we must compare it against “productive assets.” The following table illustrates the compound annual growth rate (CAGR) and the real impact on purchasing power across the last five decades.
50 Years of Market Performance: Gold vs. S&P 500 vs. CPI
|
Decade |
Gold Nominal Return (CAGR) |
S&P 500 Total Return (CAGR) |
Avg. Inflation (CPI) |
Gold Real Return |
Winner |
|---|---|---|---|---|---|
|
1970s |
30.7% |
5.9% |
7.1% |
+23.6% |
Gold |
|
1980s |
-2.4% |
17.5% |
5.6% |
-8.0% |
S&P 500 |
|
1990s |
-3.1% |
18.2% |
3.0% |
-6.1% |
S&P 500 |
|
2000s |
14.3% |
-0.9% |
2.5% |
+11.8% |
Gold |
|
2010s |
3.2% |
13.6% |
1.8% |
+1.4% |
S&P 500 |
|
2020–2024 |
9.4% |
12.1% |
4.1% |
+5.3% |
S&P 500 |
The Analyst’s Verdict: Wealth Incineration in Plain Sight
The data reveals a startling trend: Gold only “wins” during periods of systemic collapse or total loss of faith in institutions (the post-Bretton Woods 70s and the Dot-Com/GFC 2000s). In every other decade, including periods of moderate inflation, the S&P 500’s ability to pass costs onto consumers made it the superior hedge.
Look closely at the 1980s Audit. While the media remembers it as a time of high interest rates and recovery, gold holders suffered a -8.0% Real Return every single year.
FORENSIC_CALCULATION: The 1980s “Safe Haven” Trap Using the real return formula:
$$r \approx n – i$$
$$r \approx -2.4\% – 5.6\% = -8.0\% \text{ Real Annual Loss}$$
The 10-Year Cumulative Wealth Destruction: To find out how much of a $100,000 investment was left after 10 years of this “Safe Haven”:
$$\text{Ending Value} = 100,000 \times (1 – 0.08)^{10}$$
$$\text{Ending Value} \approx 100,000 \times 0.434$$
$$\text{Ending Value} \approx \$43,400$$
In Year 0: $100,000 After 10 Years of “Insurance”: ~$43,400 (in purchasing power) Result: A 56.6% loss of life’s work while “waiting” for the hedge to work.
The Final Audit: $10,000 Invested in 1974 (Inflation-Adjusted)
The opportunity cost of holding gold instead of productive American companies over the last 50 years is roughly 8 times your total wealth. If your “inflation portfolio strategy” relies on a shiny yellow rock, you aren’t buying insurance; you are paying a massive “dogma tax” to the market.
The Golden Constant: Volatility Behind a ‘Stable’ Asset
Financial academics Claude Erb and Campbell Harvey famously explored the “Golden Constant” theory, and their findings are a cold shower for gold bugs. They analyzed the gold-to-CPI ratio—the price of gold divided by the consumer price index.
Historically, this ratio has an average of about 3.46.
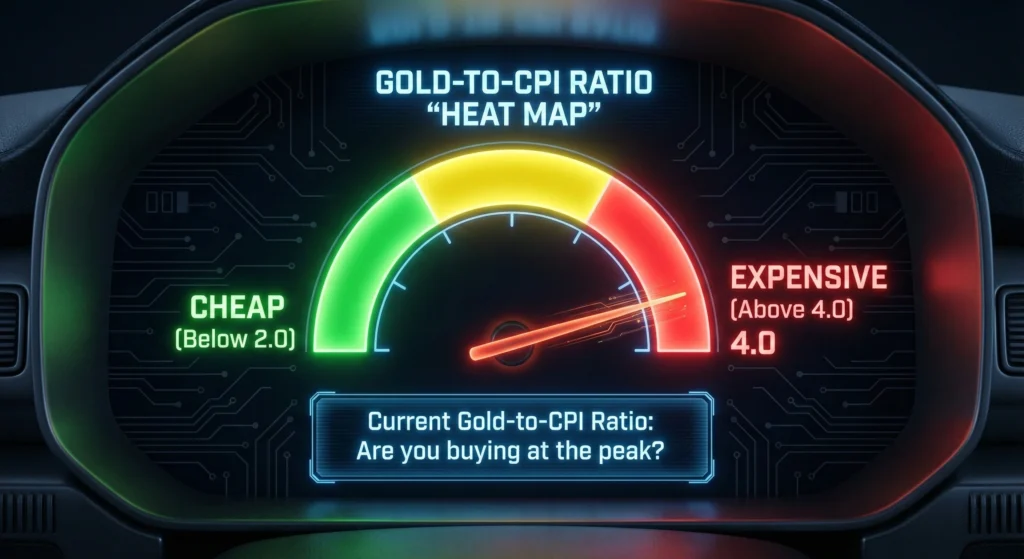
Erb and Harvey’s research suggests that gold is an effective hedge only if your investment horizon is measured in centuries. For a Roman centurion, an ounce of gold bought a high-quality toga; today, it buys a high-quality suit. But for a 45-year-old investor planning for a 20-year retirement, gold is “unreliable” at best. Its correlation with monthly inflation is a mere 0.16. In plain English: gold doesn’t care what the CPI did last month, and it certainly won’t guarantee your grocery bills are covered next year.
Why Stocks Often Outperform Gold During High Inflation
The reason gold vs stocks during inflation is an unfair fight comes down to the nature of the assets. Gold is a Static Asset. It has no earnings, no R&D, and no management team. Its only path to price appreciation is the hope that someone else will pay more for it later because they are more scared than you are.
In contrast, the S&P 500 is a collection of Productive Assets. When the price of raw materials rises (inflation), companies like Apple, Coca-Cola, or Amazon don’t just sit there and take the hit. They:
- Raise prices for consumers (maintaining margins).
- Optimize supply chains to reduce costs.
- Invest in technology to increase productivity.
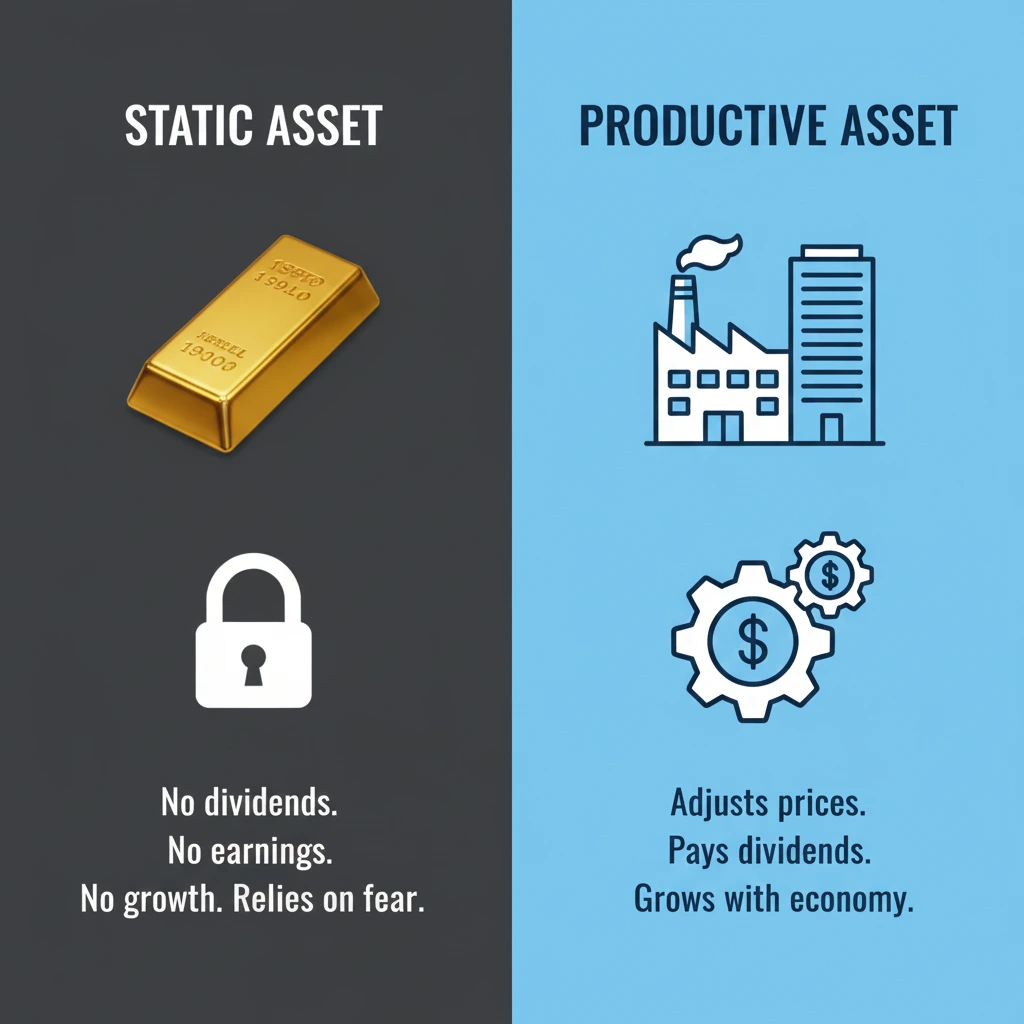
Because corporations are “living organisms” that adapt to their environment, they act as a natural, self-adjusting inflation hedge. This is why gold vs bonds high inflation comparisons often favor gold, but once you introduce equities into the mix, gold’s “safe haven” status begins to look like a trap for the mathematically challenged.
The Unpaid Analyst Takeaway: Gold is “betting on the end of the world.” Stocks are “betting that people will still want to buy things tomorrow.” Historically, the people betting on tomorrow have much larger bank accounts.
Building a Realistic Anti-Inflation Portfolio
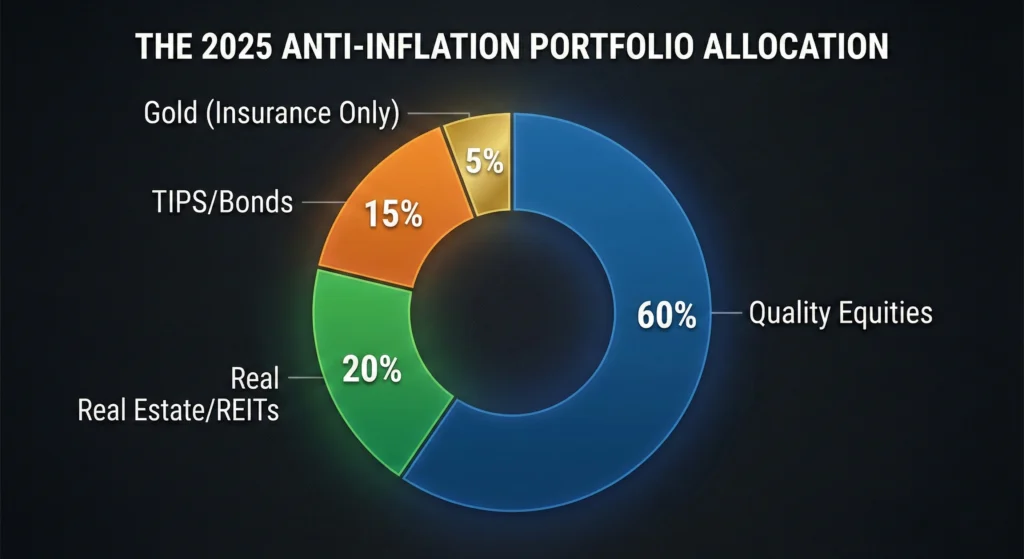
If gold isn’t the silver bullet (pun intended), what is? A sophisticated inflation portfolio strategy requires a blend of assets that provide both “protection” and “participation.”
- Quality Equities: Focus on companies with high pricing power and low capital intensity.
- TIPS (Treasury Inflation-Protected Securities): If you want a literal hedge against the CPI, buy the bond that is contractually obligated to adjust its value based on the CPI.
- Real Estate / REITs: Land and structures are finite; as the currency devalues, the replacement cost of buildings rises.
- Gold as “Insurance” (Max 5%): Treat gold like the fire insurance on your house. You pay for it hoping you never have to use it. It is a hedge against a “tail risk” event, like the total collapse of the U.S. Dollar, not a way to grow your wealth.
Conclusion: Data Over Dogma
The “Delusion of Gold” exists because it is easy to sell fear. It is much harder to sell a 50-year spreadsheet showing that the S&P 500 crushed the metal in almost every measurable timeframe. As you look at your gold investment 2025 options, remember that the accuracy of financial forecasters who scream about “the death of the dollar” is historically abysmal.
Gold is a beautiful, rare, and culturally significant metal. As a component of a diversified portfolio, it serves a purpose as a non-correlated asset. But as a primary inflation hedge? The math simply doesn’t support the myth. Real wealth is built through ownership of productive capacity, not the hoarding of inert elements.
Final Verdict: Stop watching the gold spot price and start watching the earnings yield. Time in the market beats timing the market—especially when you’re trying to outrun the silent thief of inflation.

SYSTEM STATUS: ANALYST PROFILE
The Unpaid Analyst: Zero Agenda, Raw Data. Most analysts are paid to tell you exactly what you want to hear. I’m not. On this site, mainstream narratives are dismantled using cold math and the hard facts that the media ignores to keep the public comfortable. I don’t peddle dreams or “get-rich-quick” schemes. I deliver raw macroeconomic reality—because the truth doesn’t need a sponsor.


One Comment